General Functionality
Q1. What is the purpose of the Sales & Purchase Analysis Dashboard?
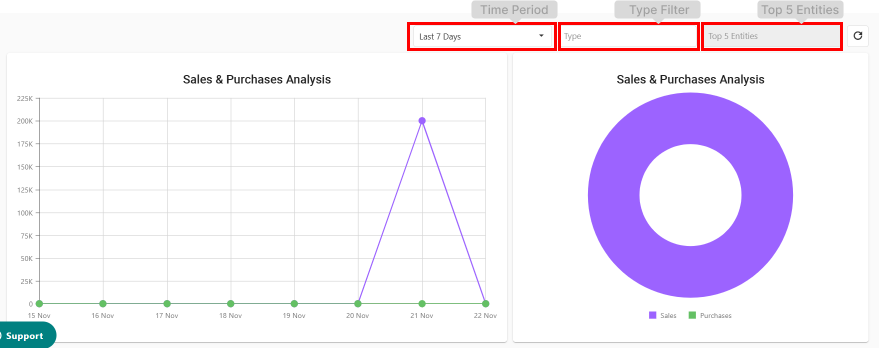
This dashboard helps users analyze their company’s sales and purchase data by visualizing trends, comparing entities, and offering detailed insights in real-time.
Q2. Who can use this dashboard?
This is specifically designed for Singapore-based companies and supports both Essentials and Premier customers.
Filters
Q3. What filters are available in the dashboard?
-
Time Period: Select time intervals (7 days, 30 days, 6 months, 12 months).
-
Type: Filter by Sales, Purchase, or Select All.
-
Top 5 Entities: Focus on the top 5 Customers (Sales) or Suppliers (Purchases).
Q4. What happens if I select "Select All" under the Type filter?
The "Top 5 Entities" filter will be greyed out because the data includes both Sales and Purchases.
Graphs
Q5. What are the interactive elements in the graphs?
-
Line Graph: Shows trends over time for up to 5 entities. Hover over data points to view details.
-
Donut Chart: Compares categories. Clicking segments drills down into detailed data.
Real-Time Updates
Q6. How does the dashboard update?
The dashboard updates in real-time when you apply filters or interact with graphs by clicking the refresh button on your top right corner, same row at the filters.
Data Conversion
Q7. How does the dashboard handle transactions in different currencies?
Transactions are converted to the home currency using the exchange rates from the Master Data (Currencies page).
Q8. What data is included for analysis?
Only Approved transactions are used:
-
Sales: Nett of Sales Invoices & Credit Notes.
-
Purchases: Nett of Bills & Debit Notes.
Use Cases and Expected Behavior
Q1. What happens if no filter is clicked?
-
The dashboard defaults to showing data for the last 7 days if any latest data available. If no : a text will display "NO DATA"
-
The Type filter defaults to displaying both Sales and Purchases.
-
The Top 5 Entities filter is greyed out, and the graphs do not display entity-specific data.
Q2. What happens if only the Time Period filter is selected?
-
If Type is not selected or set to Select All, the Top 5 Entities filter will be greyed out.
-
The graphs display both Sales and Purchases filtered by the selected time period.
Q3. What happens if the Time Period filter and Type filter are both selected?
-
The graphs show data filtered by the selected Time Period and Type (Sales, Purchases, or both).
-
The Top 5 Entities filter remains inactive unless specified.
Q4. What happens if the Time Period, Type, and Top 5 Entities filters are all selected?
-
If All Top 5 Entities is selected:
-
The graphs display data filtered by Time Period, Type, and the Top 5 Entities.
-
-
If Some Top 5 Entities are selected:
-
The graphs focus on specific selected entities, filtering by Time Period and Type.
-
Interactive Features
Q5. What happens when a user hovers over one of the entities in the graph?
-
The graph highlights the entity, displaying detailed information such as the entity’s name and the exact value for that data point.
Q6. What happens when a user clicks on one of the entities?
-
The dashboard drills down into more specific data for the selected entity, while remaining filtered by Time Period and Type.
Graph Colors
Q7. What are the graph color rules?
-
Type Filter Colors:
-
Sales: Purple
-
Purchases: Turquoise
-
-
Top 5 Entities Colors:
-
No. 1: Turquoise
-
No. 2: Purple
-
No. 3: Blue
-
No. 4: Orange
-
No. 5: Yellow
-
Q8. How does the dashboard handle ties for Top 5 Entities?
-
If two or more entities have equal values, the first five entities are displayed alphabetically.
-
Example: If D, E, and F tie for 4th place, only D and E will appear in the Top 5.
-
Comments
0 comments
Article is closed for comments.