This guide empowers you to interact with the dashboard efficiently and gain actionable insights from your data.
How to use Filters? There are 3 types of filters to choose from: time period, type & top 5 entities as highlighted in red shown below.
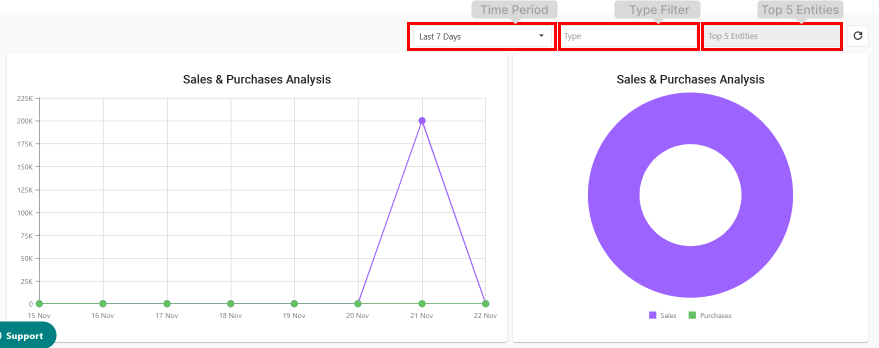
How the Default Overview and Filter Behaviors looks like
-
Dashboard will Display Default Data When No Filters Are Applied:
- Automatically show data for the last 7 days if available.
- Indicate "NO DATA" if no data is present.
- Show combined Sales and Purchases without entity-specific details.
-
When Apply a Time Period Only:
- Will exclude the "Top 5 Entities" filter if no Type is selected.
- Will display combined Sales and Purchases data for the selected period.
-
Combine Time Period + Type:
- Filter data based on your selections.
- Keep "Top 5 Entities" disabled unless explicitly activated.
-
Refine Results with All Filters:
- Filter data by Time Period, Type, and "Top 5 Entities."
- Highlight specific entities when selecting them in the "Top 5 Entities" filter.
- Time Period: Users can select from predefined intervals:
- 7 days, 30 days, 6 months, or 12 months.
- 7 days, 30 days, 6 months, or 12 months.
- Type Filter: Filters data by transaction type:
- Options: Sales, Purchases, or Select All.
- Options: Sales, Purchases, or Select All.
- Top 5 Entities: Focuses on the top 5:
- Customers for Sales or Suppliers for Purchases.
- Note: When "Select All" is chosen, the "Top 5 Entities" filter is disabled since both Sales and Purchases data are included
How to use Graphs and Interactivity?
- Donut Chart:
- Compares categories with distinct visual segments.
- Click: Drill into specific data for deeper insights.
- Analyze Categories in the Donut Chart:
- Compare data using distinct visual segments.
- Click to drill into specific categories and uncover deeper insights on the line graph
- Line Graph:
- Displays trends for up to 5 entities over time.
- Hover: Shows detailed data for specific points.
- View Trends in the Line Graph:
- Monitor trends for up to 5 entities over time.
- Hover to display detailed information for specific data points.
Interactive Features
- Hover Over Graphs: Highlight entities and reveal detailed data for specific points.
- Click on Data Points: Drill into detailed information for the selected entity while maintaining active filters.
Real-Time Updates
- Watch Data Update Dynamically: See changes applied in real-time as you adjust filters or interact with graphs.
Every time you want to change filter, remember to click refresh button as shown in RED box at the top right corner
Comments
0 comments
Article is closed for comments.