
ABSS / Financio CONNECT (Dashboard)
A business dashboard is an information management tool that is used to track KPIs, metrics, and other key data points relevant to a business, department, or specific process. Through the use of data visualizations, dashboards simplify complex data sets to provide users with at a glance awareness of current performance.
The Dashboard View is customized for Boss/Supervisor View. Below is how the Dashboard View appear.
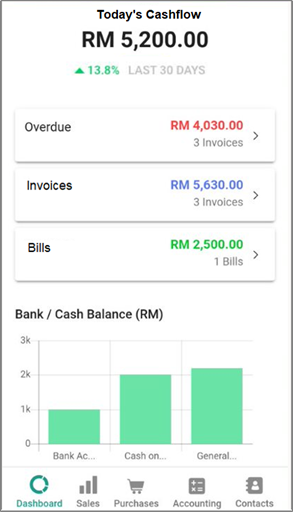
Today’s Cashflow
Today’s Cashflow is always showing the updated data up to today’s date. The cashflow amount is pulled from the total bank and cash on hand account (Bank/Cash equivalents).
The Amount in cash flow is the Total Amount from the first day of the company start date up to the current date.
The percentage (Last 30 Days) shown is the comparison between the cash flow amount from last month and this month. For example, if the user generates the cash flow report on 15th September 2020, the system will compare the previous month data (1st day of the company start date up to 15th August 2020) with the current month data (1st day of the company start date up to 15th September 2020).
The differences will be shown in percentage. The percentage can be positive or negative. Positive explains that the cash flow for the organisation has increased as compared to last month. Negative explains otherwise.
Overdue
Overdue will show the total amount in red colour. The Overdue amount is the total all amount for each overdue invoices (from the 1st day of the company). For example, as per the image above RM 4,030 is the total amount for 3 overdue invoices.
User can click on the overdue box, and the list of overdue invoice will appear.
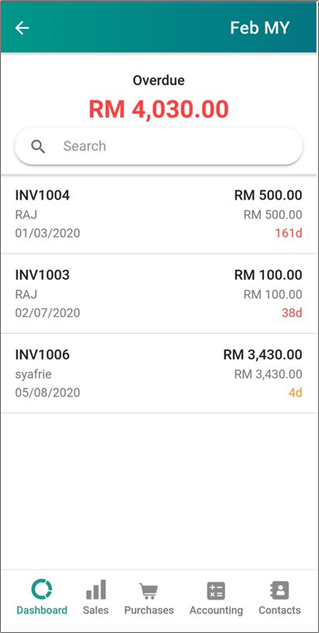
To send the reminder email to the specific overdue customer, choose the outstanding invoice > swap left and click Remind.

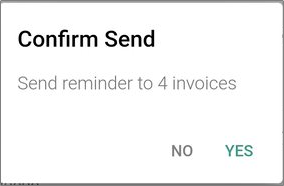
By tapping on the email icon, users can send a reminder email for all overdue invoices instantly.
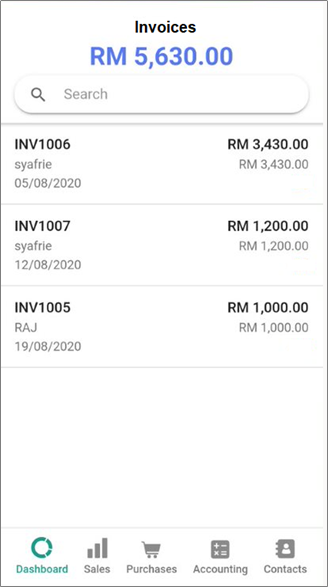
Invoices
Invoices Dashboard View - Total Invoices from 1st day of the month up to the current date of the month (generated date)
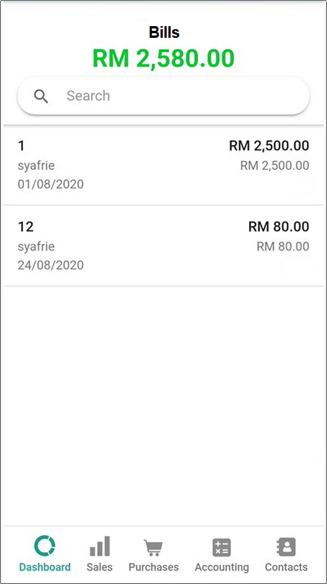
Bills
Bills Dashboard View - Total Bills from 1st day of the month up to the current date of the month (generated date)
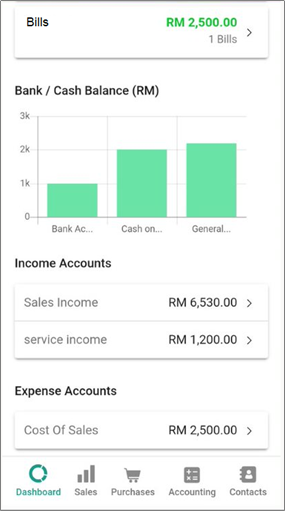
Bank/Cash Balance
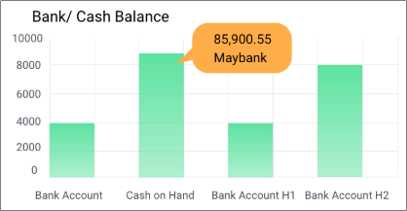
Present the current amount by bar chart for each bank/cash account. With this, the Owner will easily monitor their bank/cash amount.
Expense Accounts & Income Accounts
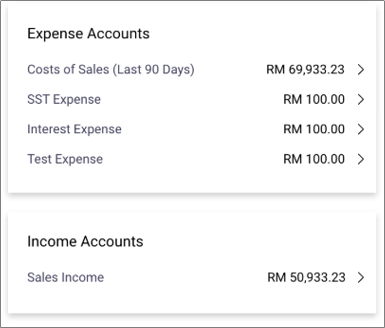
Present the total amount for each account for the last 90 days (T-90). All account under expense and income will show here. User can click the > button to see the details for each account.
Comments
0 comments
Please sign in to leave a comment.